Monitoring a Raspberry Pi: Grafana with Prometheus
This is the second part of an article about how to monitor a Raspberry Pi using Prometheus and node_explorer. The first part is available here.
In this part, we'll install Grafana with Dokku in our Digital Ocean droplet (5$/month).
4. Install Grafana in Dokku
As we did with Prometheus in the first part, we'll create the Dokku application and allow Grafana to write to the data folder.
# Create the Dokku application
dokku apps:create grafana

# Create the directory where we'll store the prometheus data
mkdir -p /var/lib/dokku/data/storage/grafana/

# The Grafana container uses the user id `472`, so we change the permissions to do that directory writable
# Related: https://github.com/grafana/grafana/blob/293ecbdd4fe1e0b636eb7d0a7e0184ace0f20a80/Dockerfile#L39-L40
sudo chown -R 472:472 /var/lib/dokku/data/storage/grafana/
Locally, we'll create the git repository and add the files needed:
# Initialize the repository
git init

# Add a new remote called `dokku` with our Dokku host
git remote add dokku [email protected]:grafanaDockerfile(using Grafana as a base, we'll include the specific configuration for nginx)nginx.conf.sigil(just to increase the size limit for POST requests from Grafana, for example to take snapshots of a dashboard).app.json(optional, but I'm using the dokku-require plugin, this file configures the mounted volumes).
FROM grafana/grafana:7.0.3

COPY ./nginx.conf.sigil .
...
...

	client_max_body_size 250m;

...
...{
"dokku": {
"volumes": [
{
"host": "/var/lib/dokku/data/storage/grafana/data",
"app": "/var/lib/grafana",
"phases": "run,deploy"
}
]
}
}
As we're using a Dockerfile Deployment, we're adding this sigil template to our application WORKDIR. It's a copy from the default template, just adding the client_max_body_size config, which allows to POST bigger requests, for example when we'll export a Grafana snapshot.
After pushing to our Dokku repository, we'll be able to connect using the default domain and port, but we can set those up:
dokku domains:add grafana grafana.mydomain.com
dokku proxy:ports-set grafana http:80:3000
dokku letsencrypt grafana
You can now open grafana.mydomain.com in your browser and enter the default user: admin / admin.
5. Connecting Grafana to Prometheus
Grafana and Prometheus are working in two different containers, so if we want Grafana to read the data from Prometheus, we have to connect both networks.
Using Dokku, it's easy to create a new network, and use it in both containers:
dokku network:create grafana-prometheus
dokku network:set prometheus attach-post-create grafana-prometheus
dokku network:set grafana attach-post-create grafana-prometheus

# After that, we could see a report of the networks per application
dokku@ubuntu-dokku:~$ dokku network:report prometheus
=====> prometheus network information
       Network attach post create:    grafana-prometheus
       Network attach post deploy:
       Network bind all interfaces:   false
       Network web listeners:         172.17.0.7:9090

# But we could use also the name of the container, for example: http://prometheus.web.1:9090
With this URL, we can create a new datasource from our Grafana website: https://grafana.mydomain.com/datasources, adding the URL of Prometheus.

After that, we can start running some queries against Prometheus, there are a bunch of examples on their website.
6. Importing a node_exporter dashboard
An interesting feature of Grafana is the ability to import dashboards; they even have a repository with lots of them.
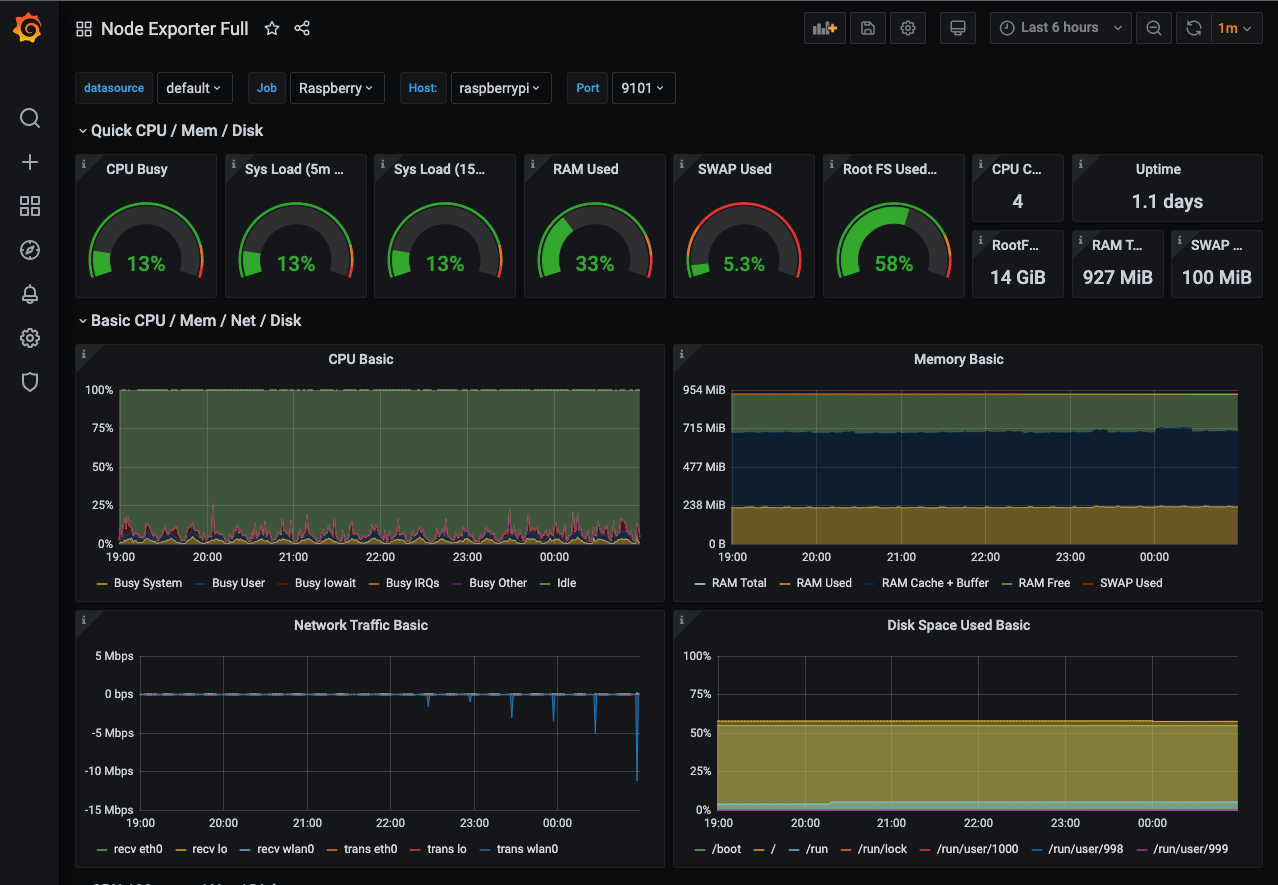
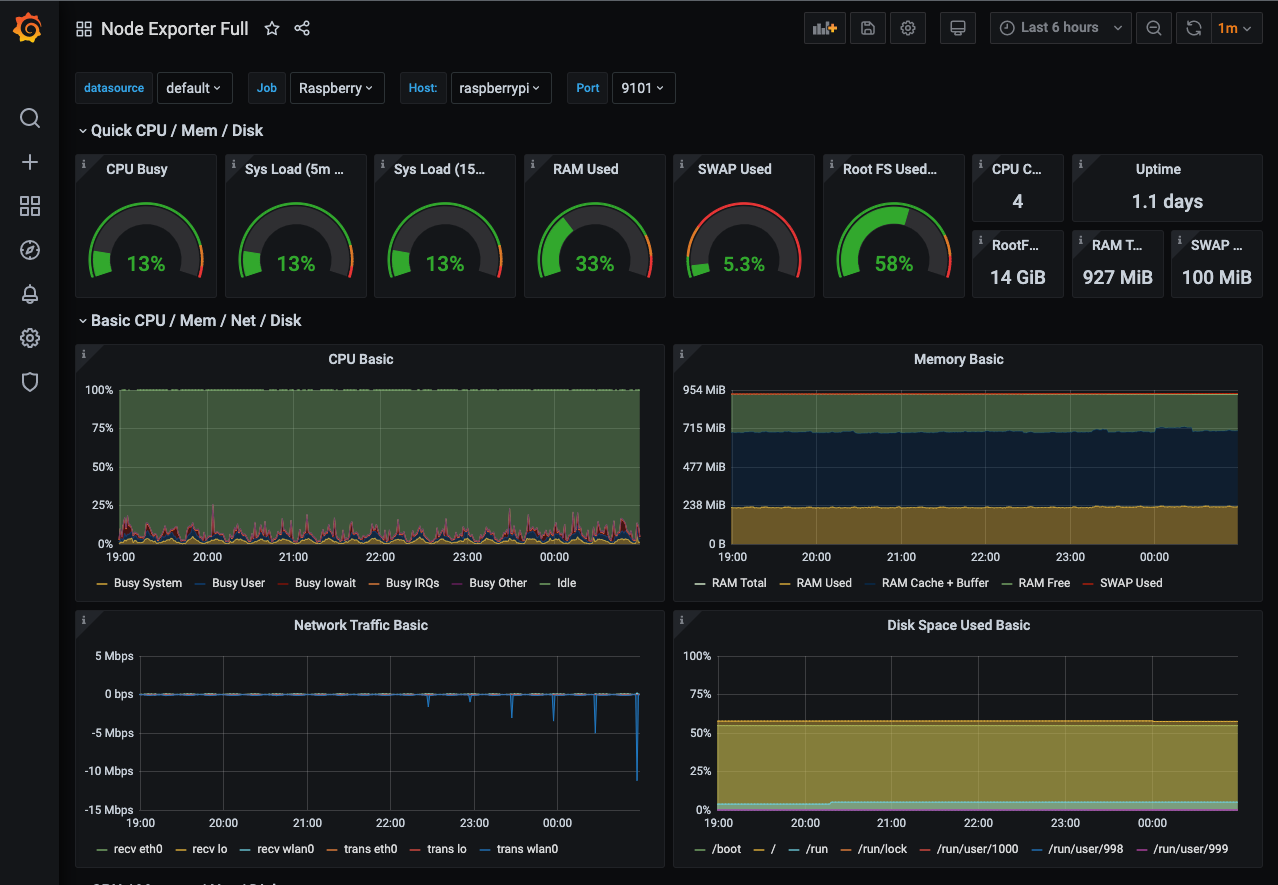
Thanks to that, we can find a Node Exporter Full dashboard, which we can import just using the ID (1860) in https://grafana.mydomain.com/dashboard/import, and we'll have a dashboard like the following.
Recap
In this part, we've seen how to install Grafana in Dokku, and also how to connect it to the Prometheus installed in the first part of this article to use as a data source.
As you've seen, this is a cheap way to monitor a server, from a Raspberry Pi at home to a more professional setup at your company, because you can even define alerts to get notified when something goes wrong.
References
- Grafana: Node Exporter Dashboard
- Github: raspberry_exporter